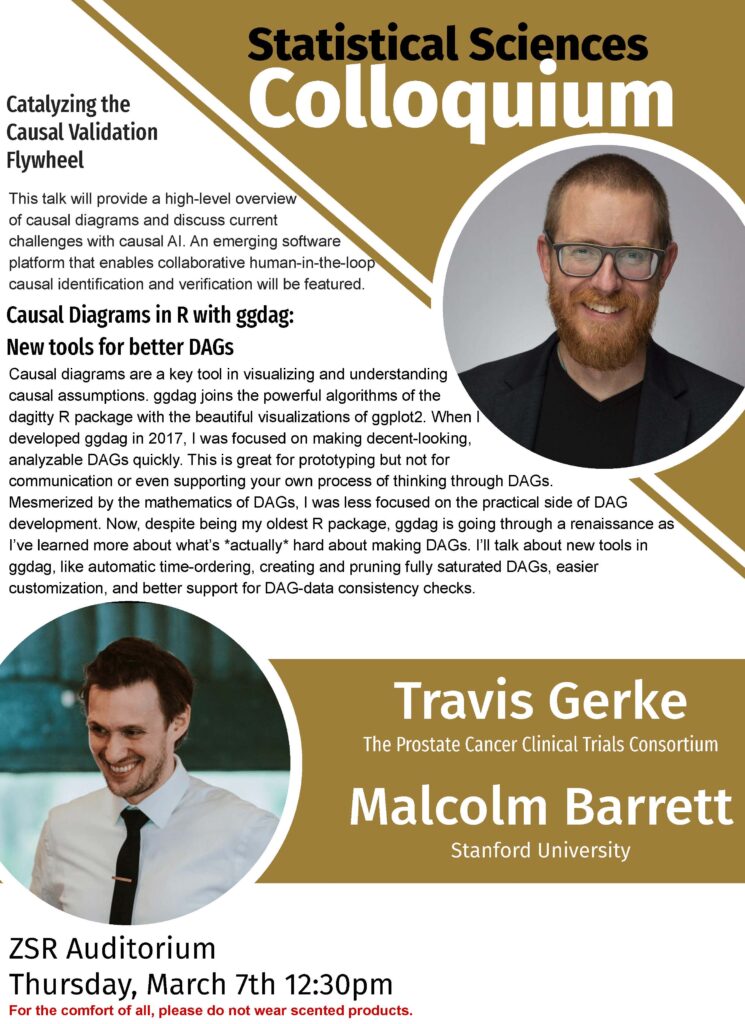
Colloquium: Catalyzing the Causal Validation Flywheel

Travis Gerke, The Prostate Cancer Clinical Trials Consortium
Malcolm Barrett, Stanford University
ZSR Auditorium, Thursday, March 7th 12:30pm
This talk will provide a high-level overview of causal diagrams and discuss current challenges with causal AI. An emerging software platform that enables collaborative human-in-the-loop causal identification and verification will be featured.
Causal Diagrams in R with ggdag: New tools for better DAGs. Causal diagrams are a key tool in visualizing and understanding causal assumptions. ggdag joins the powerful algorithms of the dagitty R package with the beautiful visualizations of ggplot2. When I developed ggdag in 2017, I was focused on making decent-looking, analyzable DAGs quickly. This is great for prototyping but not for communication or even supporting your own process of thinking through DAGs. Mesmerized by the mathematics of DAGs, I was less focused on the practical side of DAG development. Now, despite being my oldest R package, ggdag is going through a renaissance as I’ve learned more about what’s actually hard about making DAGs. I’ll talk about new tools in ggdag, like automatic time-ordering, creating and pruning fully saturated DAGs, easier customization, and better support for DAG-data consistency checks.
